MandelViz
Visualizing 2D and 3D fractals generated by behavior of complex numbers recursively passed through various functions.

A Python tool for visualizing 2D representations of computed complex number behavior iterated under various functions (e.g. quadratic Mandelbrot set, logarithmic, trigonometric), and using the Mayavi Python library to visualize 3D representations of the same behavior. Currently being redeveloped in C/C++ with OpenGL for a set of 2023 exhibits at Lawrence Hall of Science and other museums celebrating Benoit Mandelbrot’s 100th birthday (in collaboration with ex-Berkeley professor and early pioneer in chaos theory & fractal geometry Bernt Wahl).
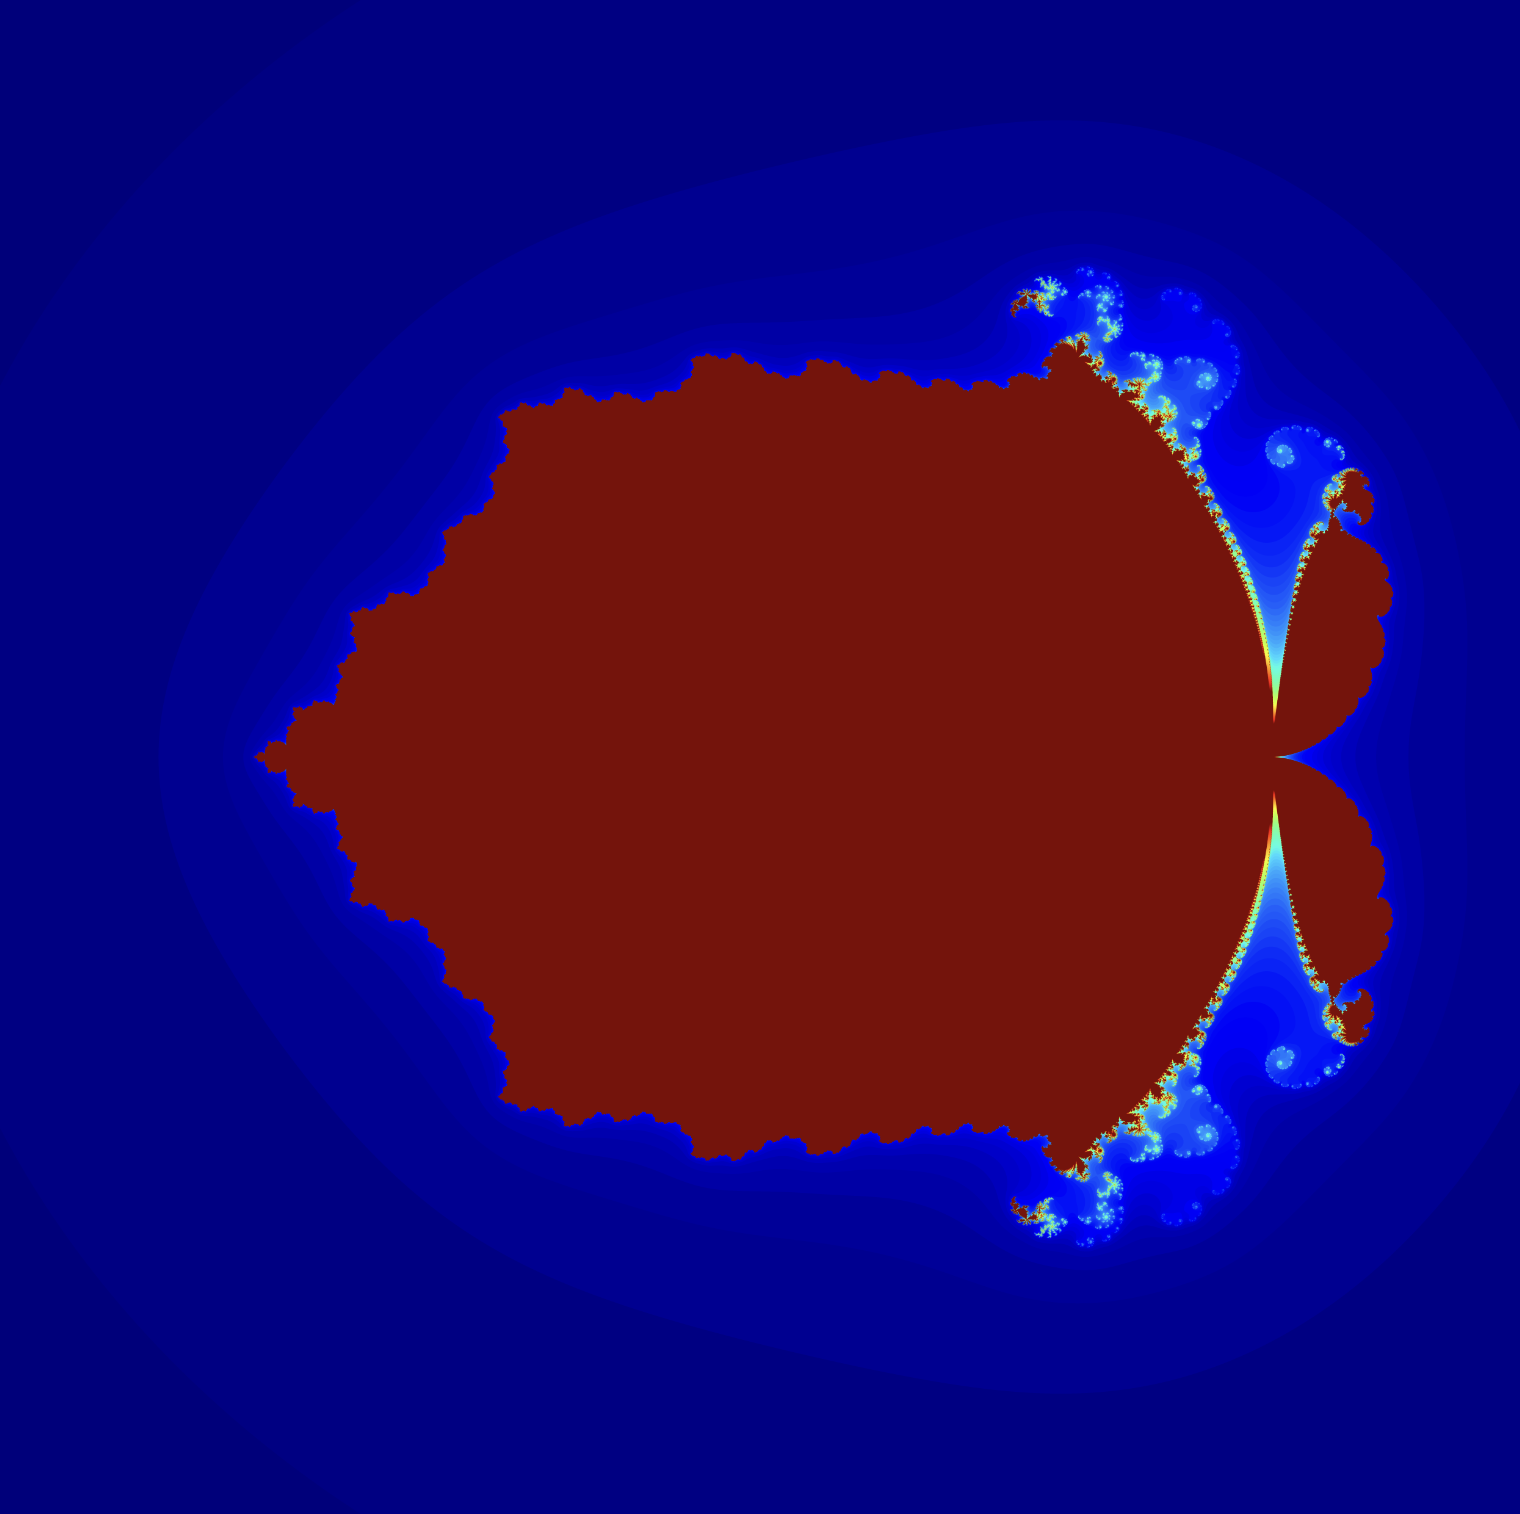
Set of numbers on the complex plane which are stable (red) and unstable (yellow-blue colormap) when iterated under:
(left) f(z(n)) = z(n-1)^2 + c, (middle) f(z(n)) = c * sin(f(z(n-1)), (right) f(z(n)) = c * log(f(z(n-1))